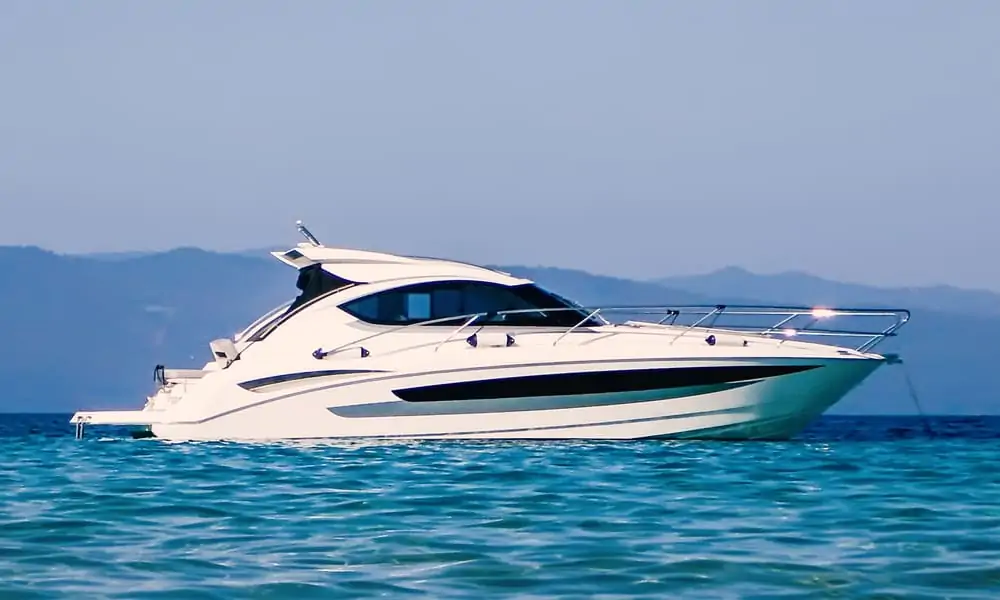
It’s no secret that Americans love boating as boating and fishing are the largest outdoor recreation activities in the U.S.
Many boat retailers are struggling to fulfill their orders, as the demand for boats has surged. Here are some of the not-widely-known boating statistics.
Boating Statistics and Facts
Highlights of statistics on boating:
- New boat sales surged 40% during the Covid pandemic.
- 100 million Americans go boating each year.
- 11.9% of U.S. households own a recreational boat.
- Millennials make up 31% of boater demographics.
- Americans spend $49.3 billion on boats, marine products, and services each year.
- 61% of boat owners have an annual household income of less than $100,000.
- Average ownership cost of a new boat is $5,000-$8,000 per year.
- Open powerboat is the most popular type of boat in the U.S.
- 95% of recreational boats are less than 26-feet in length.
- Average boat in the U.S. is operated 54 days per year.
New boat sales surged 40% during the Covid pandemic.
The recreational boating industry saw a record year in sales thanks to the Covid pandemic, as Americans had more time to spend on the water.
Boat manufacturers can’t keep up with the rising demand and new boat buyers need to wait several months for their orders.
According to the National Marine Manufacturers Association U.S. boat sales statistics, retail unit sales of new boats reached nearly 320,000 units in 2020, up 40% September through December from 2019. (1)
The recreational boating industry hasn’t seen that high sales numbers since 2008.
Sales of freshwater & saltwater fishing boats, cruisers, and jet boats also surged by double-digit numbers.
According to new and used boat registrations tracker Info-Link Technologies, first-time boat buyer statistics accounted for a whopping 31% of all new boat sales and 37% of preowned boat sales. (2)
Resulting in a 35% increase in first-time boat owners. Unfortunately, according to boating accident statistics, this increase has already resulted in more accidents, injuries, and deaths.
100 million Americans go boating each year.
It’s no secret that the Covid pandemic fueled the surge in recreational boat sales. This growth was driven by all age groups, including millennials and female boaters.
According to the Bureau of Economic Analysis, leisure boating and fishing are the largest outdoor recreation activities in the U.S., with $30.8 billion in current-dollar value-added. (3)
By estimation, there are over 140 million active boaters worldwide and an estimated 100 million Americans go boating each year. (4)
According to Mordor Intelligence boat market statistics, the recreational boating market is valued at $26 billion in 2020, with a growth target of $35 billion by 2026. This is a 5% compound annual growth rate. (5)
According to the U.S. Coast Guard Recreational Boating Statistics, there were 11,838,188 recreational vessels registered by the states in 2020. (6)
11.9% of U.S. households own a recreational boat.
The boating interest wave is stronger than ever as the pandemic has sparked interest in all outdoor activities, especially boating.
The U.S. Coast Guard recreational boat owner statistics show that about 11.9% (about 14.5 million) of U.S. households own a recreational boat. (7)
This includes everything from powerboats and houseboats to PWCs and sailboats.
States with the highest percentage of household boat owners were Maine (33.1%), Alaska (32.2%), New Hampshire (29.7%), and Minnesota (27.8%).
Conversely, states having the lowest percentage of households that own boats were Hawaii (5.0%), Nevada (5.3%), New Mexico (6.0%), and New Jersey (6.1%).
Interestingly enough, boat-owning households own an average of 1.8 boats per household.
Two or more boats are owned by half of the boat-owning households in Maine, Massachusetts, New Hampshire, New York, and West Virginia.
These boat ownership statistics also suggest that there’s evidence suggesting that shared boat ownership is trending, as this makes owning a boat more accessible for everyone.
Joint or shared boat ownership includes informal joint ownership by family and friends and shares through boat clubs.
Nearly 1.4 million boats are in some manner of joint or shared ownership. 43% of shared boats are either open or cabin powerboats.
Millennials make up 31% of boater demographics.
The general understanding has been that the average boater is in the middle-age range as boating is an expensive hobby. But this boat owner demographics is slowly changing thanks to the Covid pandemic.
Historically, the average boat owner age in the U.S. has been 58 years.
Thanks to younger people entering the recreational boating field, the average age of a recent first-time boater is now 46 years. (8)
According to the National Marine Manufacturers Association millennials boat ownership statistics, millennials make up 31% of boater demographics.
The major boating demographics distribution is as follows:
- 31% Millennials
- 37% Generation X
- 28% Baby Boomers
According to the U.S. Coast Guard boat statistics, about half (50.4%) of all boat-owning households with two or more adults don’t have children.
Conversely, 30.4% of boat-owning households do have children. (7)
Single-adult-no-children households represented 16.4% of all boat-owning households.
Americans spend $49.3 billion on boats, marine products, and services each year.
Recreational boating is booming thanks to lockdowns worldwide and social distancing.
The pandemic has created a strong growth trend among first-time boat buyers, with 415,000 first-time boat buyers entering the market in 2020. (4)
This new boater demographic consists mainly of millennials and has 1.5 times the likelihood to be women.
According to the National Marine Manufacturers Association boat sales statistics, the annual U.S. sales of boats, marine products, and services are the total of $49.3 billion in 2020, up 14% from the previous year.
Interestingly enough, 95% of boats sold in the U.S. are made in the U.S., and 93% of boat manufacturers are small businesses.
The recreational boating industry supports 691,149 American jobs and 35,277 American businesses.
According to the Global Market Insights boat report, the worldwide recreational boating market size is expected to reach $60 billion by 2027. (9)
61% of boat owners have an annual household income of less than $100,000.
There’s a common belief that boating is an expensive hobby and only accessible for the elite.
Although it can be expensive when buying the latest and most expensive equipment, it also can be reasonably priced when buying pre-owned boats and plan your costs ahead.
According to the National Marine Manufacturers Association boat facts report, 61% of boat owners have an annual household income of $100,000 or less. (4)
This means 2 out of 3 boaters are middle-class Americans.
These numbers were confirmed by the U.S. Coast Guard NRBSS boat registration statistics, that the majority of boat owners, as is often assumed, do not have high incomes. (7)
It’s important to note, that as expected, boat-owning households do have higher incomes on average.
- Less than $25,000 – 7%
- $25,000 to $49,999 – 16.1%
- $50,000 to $74,999 – 18.7%
- $75,000 to $149,999 – 37.5%
- $150,000 and over – 20.6%
Average ownership cost of a new boat is $5,000-$8,000 per year.
Buying a boat is only the first step in a boater’s journey. The real question to ask is: What is the real cost of owning a boat?
The bad news is that there’s no simple answer, but we will try to answer it nevertheless.
The reality is that the average boat ownership cost will vary a lot, depending on where you live, the make, the model, vintage, and many other factors.
According to Action Water Sports boat maintenance statistics, the average ownership cost of a new boat is $5,000 to $8,000 per year. (10)
Allied Market Research boat data suggest that the average annual boat ownership of a recreational boat stays between $3,000 to $10,000. (11)
Here are some of the main boating-related costs you need to take into consideration:
- State taxes
- Insurance
- License and registration
- Mooring
- Winter storage
- Gas
- Maintenance and repairs
- Trailer and tow vehicle
- Safety items
- Navigation equipment
- Safety education
Open powerboat is the most popular type of boat in the U.S.
According to the U.S. Coast Guard us registration statistics by boat, open powerboats are the most popular type of boat in the U.S. Almost 6 million households own at least one open powerboat. (7)
According to the National Marine Manufacturers Association marine statistics, 2020 retail sales of new powerboats reached 320,000 in units sold. (4)
The recreational boating industry hasn’t seen these levels since before the Great Recession in 2008.
These new powerboat categories are driving record retail unit sales. (4)
| Boat type | Units sold | Change |
| Personal watercrafts (PWC) | 82,500 | Up 8% |
| Wake sport boats | 13,600 | Up 22% |
| Fishing and pontoons boats | 144,700 | Up 13% |
95% of recreational boats are less than 26-feet in length.
According to the U.S. Coast Guard boat industry statistics, 95% of recreational boats registered in the U.S. in 2020 were less than 26-feet in length. (6)
The majority of boats (58.73%) are between 16-26 feet long and 35.92% of all registered boats are under 16 feet in length.
| Length | Percentage of all boats |
| Under 16 feet | 35.92% |
| 16 to less than 26 feet | 58.73% |
| 26 to less than 40 feet | 4.60% |
| 40 to 65 feet | 0.65% |
| Over 65 feet | 0.10% |
With an average boat length of less than 26-feet means, most boats can be trailered by vehicle to local waterways.
The U.S. Coast Guard estimates that boats are trailered for launching about 167 million times each year. (7)
Interestingly enough, one boat is trailered or transported an average of 28 times per year.
Of all the U.S. states, Florida has the highest number of boats operated yearly.
For example, in 2018, about 334,000 boats were trailered at least once, followed by 296,000 boats in Michigan, 282,000 boats in Texas, and 278,000 boats in Georgia.
Average boat in the U.S. is operated 54 days per year.
According to the U.S. Coast Guard vessel statistics, an average boat in the U.S. is operated 54 days per year. (7) This is an average of 15.2% of the year.
A day is any part of a day on which the boat was taken out on the water under power, this includes engines, sails, and human power.
States where boats were operated more days, on average, include North Dakota (71 days),
Maine (63 days), Alaska (62 days), and Minnesota (62 days).
States where boats were operated fewer days, on average, include Nebraska (30 days) and West Virginia (33 days).
The report also revealed an interesting controversy.
Contrary to what is often assumed, boats in southern states are not operated more days, on average, than boats in northern states.
| Census Regions | Days of Operation |
| Midwest | 56 days |
| Northeast | 55 days |
| South | 52 days |
| West | 52 days |
References
- National Marine Manufacturers Association. 2021. Report: Nearly 320,000 New Boats Sold in 2020. Link
- Soundings Trade Only Magazine. 2020. First-Time Boat Buyers Leap in 2020. Link
- The Bureau of Economic Analysis. 2020. Outdoor Recreation Satellite Account, U.S. and States, 2020. Link
- National Marine Manufacturers Association. 2021. Report: Recreational Boating Boom Continues as Americans Turn to the Water in the Wake of COVID-19 Pandemic. Link
- Mordor Intelligence. 2021. Recreational Boating Market – Growth, Trends, Covid-19 Impact, And Forecast (2021 – 2026). Link
- U.S. Coast Guard. 2020. Recreational Boating Statistics 2020. Link
- U.S. Coast Guard. 2020. National Recreational Boating Safety Survey. Link
- National Marine Manufacturers Association. 2021. State of the Recreational Boating Industry. Link
- Global Market Insights. 2020. Recreational Boating Market Size By Product, Outboard Boats By Type, By Horsepower, Inflatables, By Engine, COVID-19 Impact Analysis, Regional Outlook, Growth Potential, Competitive Market Share & Forecast, 2021-2027. Link
- Action Water Sports. 2021. What is the true cost of owning a boat? Purchase price vs. cost of ownership. Link
- Allied Market Research. 2021. Recreational Boating Market by Power, Product Type, Activity Type and Size: Global Opportunity Analysis and Industry Forecast, 2020–2027. Link


