


Developers of boat and RV storage properties most determine two key factors before taking any other steps on the path to building and operating a successful storage property:
- Determining boat and RV ownership in an area, and
- The number of existing facilities within the locale.
Boat Ownership in the United States
By Frank Bongiorno
Boating is a true American passion — an estimated 100 million Americans enjoy boating each year. Annual U.S. sales of boats, marine products, and services  reached an impressive $49.3 billion in 2020. Of these marine vessels, 95% were made in the United States, which is a testament to the nautical devotion that is deeply anchored to American heritage.
In fact, according to the U.S. Department of Commerce’s Bureau of Economic Analysis, recreational boating and fishing was the number one contributor to the $689 billion outdoor recreation economy. So which state is the “captain” of boat ownership? The team at Staten Island Yachts has reeled in some fascinating data to discover which states have the most boats and yachts per capita.

Boat sales continue to grow
Have you ever looked out and admired the countless serene sails swaying on glittering waters and wondered, “How many boats are in America?” The National Marine Manufacturers Association has the answer: There are 17 million recreational boats and yachts (13 million registered and 4 million unregistered) in the United States.
Which state has the most boats?
It may come as a surprise that Minnesota is the state with the most boats per person, at approximately 143.6 boats per thousand people. What percentage of Minnesotans own a boat? Seven percent of Minnesotans own a boat, making it the unofficial boating capital of the United States. That’s about one in every six Minnesotans owning a boat, with that number shifting to one in three as you head north of Duluth.
Minnesota is called “The Land of 10,000 Lakes” (11,842 to be exact), so there is a dazzling abundance of open waters to choose from! It’s home to Lake Superior, the largest freshwater lake in America and the largest lake in the world by surface area. More fun facts about Lake Superior are that it spans 31,700 square miles and holds 10% of Earth’s surface fresh water! Lake Superior boating is wonderful because the average underwater visibility is 27 feet, making it the cleanest and clearest of the Great Lakes. You can discover many infamous Lake Superior shipwrecks, access the pristine, isolated Isle Royal National Park by boat or yacht, or explore one of the 30 lighthouses along the shore. But is Lake Superior good for fishing? Absolutely! It is home to more than 80 species of fish and fed by more than 200 rivers.
Boat Registrations by State
Florida is the state with the most registered boats used for recreation, claiming 8.133% of all recreational boat and yacht registrations in the United States. Florida boat sales also lead the fleet at $4.3 billion in 2020. In March of 2022, the Florida Fish and Wildlife Conservation Commission announced that Florida boat registrations had surpassed 1 million!
Of course, with so many boaters enjoying all of the wondrous waterways Florida has to offer, it is important to be safe. The FWC has provided a treasure chest of boating safety tips that are vital no matter where in America you set sail. (It’s never a bad idea to print out boating safety tips for boat storage tenants!)

 Frank Bongiorno is president of Staten Island Island Yacht Sales, which specializes in new and used boat/yacht sales in New York.
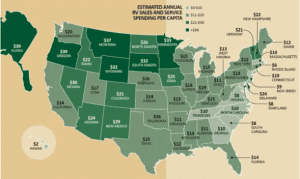
Which U.S. States Spend the Most on RVs Per Capita?
By Carly Hallman
Exploration, freedom and adventure are cornerstones of American culture and history. The United States is vast and varied, offering countless vistas and experiences within its 2,800-mile span.
RVs are a symbol of America’s pioneering spirit and thirst for the freedom that the wide open road offers. In fact, many people would include “traveling cross-country in an RV” on their bucket list! This infographic visualizes the U.S. states where people spend the most per year on RV sales and service.
See full infographic at TitleMa
| State | Total RV Sales and Service Spending | Estimated Annual RV Sales and Service Spending Per Capita |
| Alabama | $55,700,000 | $11 |
| Alaska | $28,800,000 | $39 |
| Arizona | $174,400,000 | $24 |
| Arkansas | $34,200,000 | $11 |
| California | $549,800,000 | $14 |
| Colorado | $119,900,000 | $21 |
| Connecticut | $67,800,000 | $19 |
| Delaware | $23,600,000 | $24 |
| Florida | $306,200,000 | $14 |
| Georgia | $103,400,000 | $10 |
| Hawaii | $3,500,000 | $2 |
| Idaho | $40,100,000 | $22 |
| Illinois | $173,800,000 | $14 |
| Indiana | $129,400,000 | $19 |
| Iowa | $79,000,000 | $25 |
| Kansas | $40,600,000 | $14 |
| Kentucky | $67,800,000 | $15 |
| Louisiana | $57,000,000 | $12 |
| Maine | $15,900,000 | $12 |
| Maryland | $47,000,000 | $8 |
| Massachusetts | $69,800,000 | $10 |
| Michigan | $150,400,000 | $15 |
| Minnesota | $187,400,000 | $33 |
| Mississippi | $38,900,000 | $13 |
| Missouri | $81,200,000 | $13 |
| Montana | $39,300,000 | $37 |
| Nebraska | $30,200,000 | $16 |
| Nevada | $92,600,000 | $30 |
| New Hampshire | $29,600,000 | $22 |
| New Jersey | $79,700,000 | $9 |
| New Mexico | $61,200,000 | $29 |
| New York | $225,900,000 | $12 |
| North Carolina | $104,700,000 | $10 |
| North Dakota | $19,600,000 | $26 |
| Ohio | $134,000,000 | $11 |
| Oklahoma | $63,400,000 | $16 |
| Oregon | $165,600,000 | $39 |
| Pennsylvania | $170,600,000 | $13 |
| Rhode Island | $6,600,000 | $6 |
| South Carolina | $41,700,000 | $8 |
| South Dakota | $28,500,000 | $32 |
| Tennessee | $65,100,000 | $10 |
| Texas | $424,200,000 | $15 |
| Utah | $55,500,000 | $17 |
| Vermont | $13,000,000 | $21 |
| Virginia | $70,500,000 | $8 |
| Washington | $155,700,000 | $20 |
| West Virginia | $23,300,000 | $13 |
| Wisconsin | $89,600,000 | $15 |
| Wyoming | $18,400,000 | $32 |
Here are the top 25 U.S. states where people spend the most per year on RV sales and RV service per capita:
- Alaska: $39 per year per capita
- Oregon: $39 per year per capita
- Montana: $37 per year per capita
- Minnesota: $33 per year per capita
- South Dakota: $32 per year per capita
- Wyoming: $32 per year per capita
- Nevada: $30 per year per capita
- New Mexico: $29 per year per capita
- Iowa: $25 per year per capita
- Arizona: $24 per year per capita
- Delaware: $24 per year per capita
- Idaho: $22 per year per capita
- New Hampshire: $22 per year per capita
- Vermont: $22 per year per capita
- Colorado: $21 per year per capita
- Washington: $20 per year per capita
- Connecticut: $19 per year per capita
- Indiana: $19 per year per capita
- Utah: $17 per year per capita
- Oklahoma: $16 per year per capita
- Nebraska: $16 per year per capita
- Texas: $15 per year per capita
- Wisconsin: $15 per year per capita
- Michigan: $15 per year per capita
- Kentucky: $15 per year per capita
Here are the top ten U.S. states where people spend the most per year on RV sales and service overall:
- California: $549,800,000
- Texas: $424,200,000
- Florida: $306,200,000
- New York: $225,900,000
- Minnesota: $187,400,000
- Arizona: $174,400,000
- Illinois: $173,800,000
- Pennsylvania: $170,600,000
- Oregon: $165,600,000
- Washington: $155,700,000
Carly Hallman writes for TitleMax, one of the nation’s largest title lending companies.
LEARN MORE AND REGISTER FOR THE WORKSHOP HERE.


